Pegasus
Teacher-Led MIS for Education
Background
What was Pegasus?
Whilst I was used to using and generating data at a class level, this was my first experience of manipulating data on an institution level.
Where the education sector was full of MIS (Management Information Systems) software, at the time there was a market gap for MIS products built for use within the classroom.
The ethos behind Pegasus’ design was “Data for teachers who don’t do data” – the brief being twofold:
Create a system to bridge the gap between Management data and In-class data for the maths department.
Make the end result as clear as possible for easy reference in the classroom.
What started as a pet project to replace paper based markbooks in maths, grew into something much more powerful…

Design Considerations
Whilst the ideal choice for this task would’ve been a database, given that this product was designed for use by teachers (rather than data managers), a spreadsheet format was chosen instead.
This meant that a UI had to be developed as a font end, to allow easy navigation and processing.
The output had to be clearly readable, but afford the teacher with enough data to be able to plan and teach effectively.
Security was also a concern: as there was a significant amount of student data present within Pegasus, it had to be kept secure.

Flexibility in Mind
This project initially started as a project within the maths department, but quickly grew in popularity, resulting in Pegasus being implemented in multiple subject areas:
- Maths
- English
- Science
- Humanities
- Dance/ Drama
This was handled by creating a dataset input sheet, which was compatible with SIMS (the school’s existing MIS), which Pegasus was able to switch between in order to generate the correct datasheets for each department.

Student, Class & Year Group Level Data
Pegasus was capable of ‘deep diving’ into departmental data, affording class teachers and middle leaders alike, the ability to quickly track attendance, progress, attainment, behaviour and much more, at the click of a few buttons:
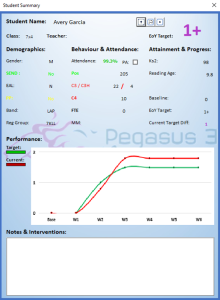
Student Summary
This form came in particularly useful at parent’s evenings, as all attendance, behaviour, progress and attainment data for each student is all readily available, and conformed with institution ‘colour coding’ for Pupil Premium, SEND and attendance data, making this a quick and easy way of relaying information.
Teacher Marksheet
This output contained all pertinent student data for a class. These were especially useful when used to track interventions of students, and check progress and attainment ‘at a glance’.
Classes could be switched between using the in-built filter / control, and easily exported as a PDF (or direct to print) for reference and later use.

Whilst this datasheet could be kept ‘live’ within the program itself, this was designed to be an automated, paper-based* replacement to the act of having to update teacher planners by hand.
Data was kept up to date using the institution’s MIS, and the ‘bulk print’ feature in the menu allows for easy printing for multiple classes.
*(Institution guidelines at the time mandated staff to keep ‘teacher files’ available to hand for any observations / learning walks, which meant that this had to have a paper-based output)
Class Summary

Attendance & Behaviour.
Notes average attendance, and highlights students who may require interventions
Progress & Attainment:
Records average class attainment & progress between assessment points, against student targets.
‘Target Groups’:
Links to the class marksheet to highlight ‘Pupil Premium’ and SEND students so individual interventions can be implemented.
‘Grade Distribution’
Shows the spread of grades achieved by a class, against baseline and target.
Cohort Summary
This dashboard looked at whole year groups. Intended for heads of department in particular, this form allowed ‘snapshot’ views of the progress of an entire year group, at various stages in the academic year.
With the school being in special measures at the time, this data was invaluable when it came to targeting support for various target groups (PP, SEND and Boys being regarded as the most critical at the time).
The grade summaries allowed middle leaders to view the spread of results across a year group, which made reporting to SLT more efficient.

The grade summary table would change its headings depending on which year group was being viewed. For example, year 7s progress was measured at grades 9 – 3 and below, whereas year 11 progress was measured at grades 9-7, 9-5 (‘good pass’), and 9-4 (standard pass).

Summary & Next Steps
Essentially, Pegasus was designed to be a ‘dashboard’ for staff to effectively track students over time. Whilst Power BI may well have been better able to provide these insights, it was not available to me at the time.
The core benefits of this system were:
What would I do differently in 2025?
Whilst this project shows a certain amount of ingenuity, I was still very much an ‘enthusiastic amateur’ at the time, looking to develop and enhance my technical skillset whilst honing my teaching practise.
One way of enhancing this program further would be by developing a database- style model, however this would overlap with existing technologies available (The school’s principal MIS was a reskinned database at the time), therefore making Pegasus redundant.
If I were to continue developing Pegasus, I would definitely go down the Power BI route, as this would still play into my VBA/Spreadsheet skillset, but would offer much more ‘polished’ dashboards and insights for class teachers.